THE INFORMATION EDGE
PITCHING COACH ROBERT WOODARD AND A GROUP OF STUDENTS HAVE GIVEN THE DIAMOND HEELS A NEW WAY TO DO WHAT THEY DO
By: PAT JAMES / Photos by: JEFFREY CAMARATI
IT BEGAN WITH A HATRED FOR PIANO LESSONS.
Through kindergarten and most of first grade, Robert Woodard returned home from school each weekday and spent the afternoon playing outside. Most children his age developed a similar routine.
his parents insisted he needed a hobby.
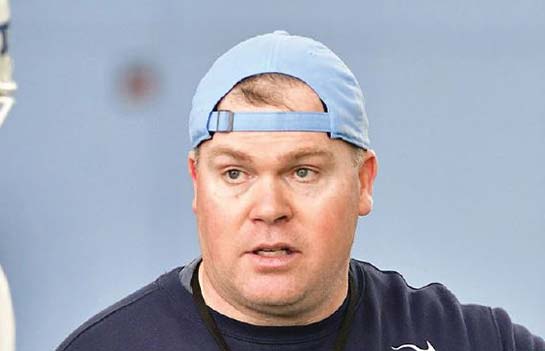
So they sent him to piano lessons for about a year. Almost 27 years later, Woodard, entering his second season as the North Carolina baseball team’s pitching coach, said he’s surprised he made it that long. The black and white keys exasperated him. If engaging in a non-sports related activity was necessary, he longed for another.
Some of his friends participated in chess club. That alone encouraged him to join in the second grade. Although he knew little about the game, he won his first. And he quickly became hooked.
“From second grade to eighth grade, I probably played as much or more chess than baseball and sports,” said Woodard, a North Carolina state chess champion in middle school. “When I wasn’t playing sports, I was playing chess, I was studying chess, playing in tournaments, playing online. It was something I just really, really enjoyed.
“It taught me a lot in terms of thinking ahead, strategy and understanding sometimes the worst move right away is actually the best move 10 moves down the line and sometimes the best move initially is the worst move down the line.”
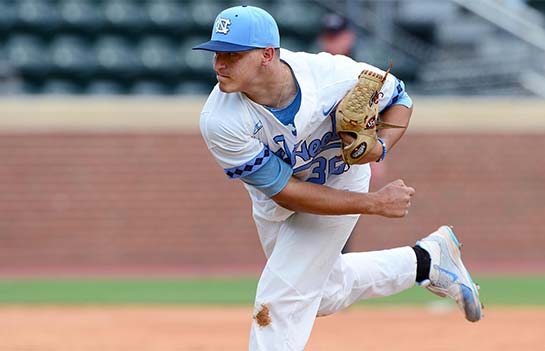
Woodard embraced that calculated approach not only as a chess player but also as a pitcher, winning a UNC record 34 games from 2004-07. Now he’s doing the same as a coach.
Last season, his first back in Chapel Hill, Woodard helped assemble a student-driven data and analytics team headed by Micah Daley- Harris, a current sophomore majoring in statistics and analytics. The group has steadily grown in size and responsibilities. And it’s the primary reason the program remains at the forefront of video and data collection in college baseball.
“Lots of the work and prep and information is done before the game and before practice,” Woodard said. “So then we can have a better idea of what we’re trying to do and then go do it, as opposed to before, we were usually looking back at things. Now we’re looking ahead.”

‘A TRAINING GROUND’
When the Montreal Expos moved to Washington, D.C., and became the Nationals in 2005, they played at RFK Stadium, near Daley-Harris’ home. He and his father often walked up on game days and bought $5 nosebleed seats.
From then, his love for analyzing baseball grew.
Daley-Harris also played the game. But around ninth grade, he realized he’d never reach the college level and started dreaming of working in an MLB team’s front office.
He watched “Moneyball,” the 2011 movie about the 2002 Oakland Athletics’ use of analytics to muster a competitive baseball team despite a restricted budget. A math enthusiast, he identified an area in which he could thrive.
He began working toward that in high school, first studying sports analytics in the Wharton Moneyball Academy – a one-week program at the Wharton School of the University of Pennsylvania – and then publishing his own research on a blog and The Hardball Times. He saw his arrival at UNC in 2016 as a chance to accumulate more experience.
So early in his freshman year, Daley-Harris emailed head coach Mike Fox and associate head coach Scott Forbes. There was a five percent chance, he thought, that he’d receive a response. But those odds proved more favorable.
Director of baseball operations Dave Arendas replied, and he and Woodard met with Daley-Harris a few days later. Daley-Harris came prepared to sell them on how he could help. It took little convincing.
“I met with Coach Woodard,” Daley-Harris said, “and I’ll never forget he said, ‘The one thing I want you to remember is don’t feel like you need to walk on eggshells, don’t feel like you can’t do this or can’t do that.’
“For me, that just opened the floodgates of, ‘How many things can we do to be helpful and make this team be as successful as possible?’”
Daley-Harris spent his first two weeks working on the Tar Heels’ recruiting database, inserting emails and headshots. But Woodard recognized his talents were being underused. He subsequently gave Daley-Harris permission to do what he wanted, to assist with player development and in-game decision-making.
They started brainstorming how they could use old play-by-play data and other information to predict tendencies. Daley-Harris’ hours at Boshamer Stadium significantly increased. And before long, Woodard knew the one-man data and analytics team needed to expand.
It began with the addition of just one more student. But eventually, they added more through a process that saw about 40 applicants. The final pool of candidates consisted of males and females, freshmen and graduate students, statistics and economics majors.
The data and analytics team currently features Daley-Harris and six other students. Each possesses baseball experience, ranging from playing Little League to receiving Division III offers.
“This is where the game is going,” Woodard said. “There are career paths, very enticing career paths, that involve analytics and this type of work. So if there’s a way for us where we can create kind of a training ground for students who want to have a career in baseball – be it professional, front office, player development, whatever it might be – why not give them a home to develop their skill sets and prepare?”
‘THE NUMBERS DON’T REALLY LIE’
Each game UNC played last season typically began the same.
Even in the opposing team’s first time through its batting order, the Tar Heels shifted their defense accordingly for each hitter based off play-by-play information collected and parsed by the data and analytics team.
Analytic projections can be made from this data. Among them, UNC tends to know who hits the ball where most often.
Several other schools can access such information. And in the final contest of most three-game series, the Tar Heels’ opponent mimicked them by shifting their defense, too. But many programs don’t know how to regularly apply this data, or they hesitate to stray away from the philosophies that players and coaches are accustomed to, like keeping infielders equidistant from each other.
“It takes some courage from you as a coaching staff and even more so from the players to do those things,” Woodard said. “You start to see it. When you see it pay off, it’s pretty cool.”
Last season, UNC’s analytical approach helped it finish 49-14, win the ACC Coastal Division title outright and establish a new school record with 23 conference wins. And perhaps no change was more crucial to the team’s success than the employment of defensive shifts.
The Tar Heels’ .979 fielding percentage matched their best since the 2011 season. According to Daley-Harris, shifting prevented about 70 hits and 49 runs scored.
“We just want to put our guys in positions where they’re not going to have to go as far to get to a ground ball,” said Daley-Harris, who completed a baseball analytics internship with the Arizona Diamondbacks last summer and still works for the organization on an ad hoc basis.
“So all of a sudden, if we can help them record more outs and increase their fielding percentage, all by letting them use their talents, that’s generally what we kind of view as our role.”
But that role isn’t just limited to helping on defense.
Radar-based tools such as TrackMan and a Rapsodo pitch-tracking camera, one of the team’s newest pieces of equipment, can measure a pitch’s spin axis – the direction that the pitch spins – and spin rate – the amount of spin on a baseball after it’s released. Those metrics can help pitchers learn where in the strike zone they’ll find the most success against particular hitters.
The data and analytics team also runs TrackMan during batting practice. From it, sophomore catcher/outfielder Brandon Martorano said he can learn what adjustments he should or shouldn’t make at the plate.
With so many numbers available, Woodard said Daley-Harris and the rest of the data and analytics team excel at educating the coaching staff on what they all mean and ensuring they receive the most useful information. The coaches then decide the proper time to distribute it to the players.
“What’s great is they’re honest,” said Daley-Harris of the coaches and players. “If they don’t understand something, they’ll say, ‘I don’t understand it.’ If they think that something is just too much information for them to have, they’ll say, ‘Hey, I can’t go through all this.’ So we’ve grown, we’ve gotten better and we’ve kind of refined our information.”
‘STAYING AHEAD’
One of the leadoff hitter’s biggest responsibilities has traditionally been to see a lot of pitches. Even if he strikes out, he can return to the dugout and give his teammates a better sense of what the pitcher is throwing.
But with a subscription to Synergy Sports Technology, a cloud-based video and analytics system, UNC’s leadoff man will have an even better feel for the opposing pitcher before his first at-bat.
Synergy features video and analysis of every pitch, player, plate appearance, game situation and outcome. So if any Tar Heel needs to scout an opposing pitcher, they can sign in and watch every pitch he’s thrown since the start of last season, see other hitters’ statistics against him and view a breakdown of how often he throws each of his pitches in certain situations.
“If we can get to a point where our leadoff hitter is already on his third at-bat of the game in his first at-bat of the game,” Woodard said, “that’s staying ahead.”
But it’s far from the only way UNC is doing so.
Brett Pexa, a former graduate assistant athletic trainer for the baseball team and a current doctoral student studying human movement science, has created two phone applications for pitchers to use in an effort to learn how mental readiness and workload influence each other.
The pitchers access the readiness tracker every morning. They then log how ready they feel on a scale of 1-10, the amount of sleep they got, descriptions of how they slept and their mood, fatigue and stress ratings, and if they’re experiencing any sort of soreness. All of this information is then combined into a report that helps Woodard know how to handle certain players.
Later in the day, the pitchers open the workload tracker and provide a summary of what they did in practice.
So each day, shortly after lunch, Woodard walks down from his office in the upper deck of Boshamer Stadium to the clubhouse area at field level. He’s received the readiness reports by then. And if a player is abnormally stressed or sore, Woodard will find him so they can discuss what’s wrong.
At some point, he’ll also stop and play a game of chess.
Woodard bought a chess board for the players’ lounge last year. He knew then at least a few players understood the game, but it turned out about half the team was familiar with how the pieces move. So much interest built that he later added a second board. To combat waiting lines, he also purchased clocks.
The players might not know it. But like Woodard, they, too, are learning to look ahead.
This story appeared in the FEBRUARY 2018 edition of Born & BredMore Stories
The impact of giving comes through in wonderful stories about Carolina student-athletes and coaches, as well as the donors who make their opportunities possible. Learn more about the life-changing impact you can have on a fellow Tar Heel through one of the features included here:
